
Services
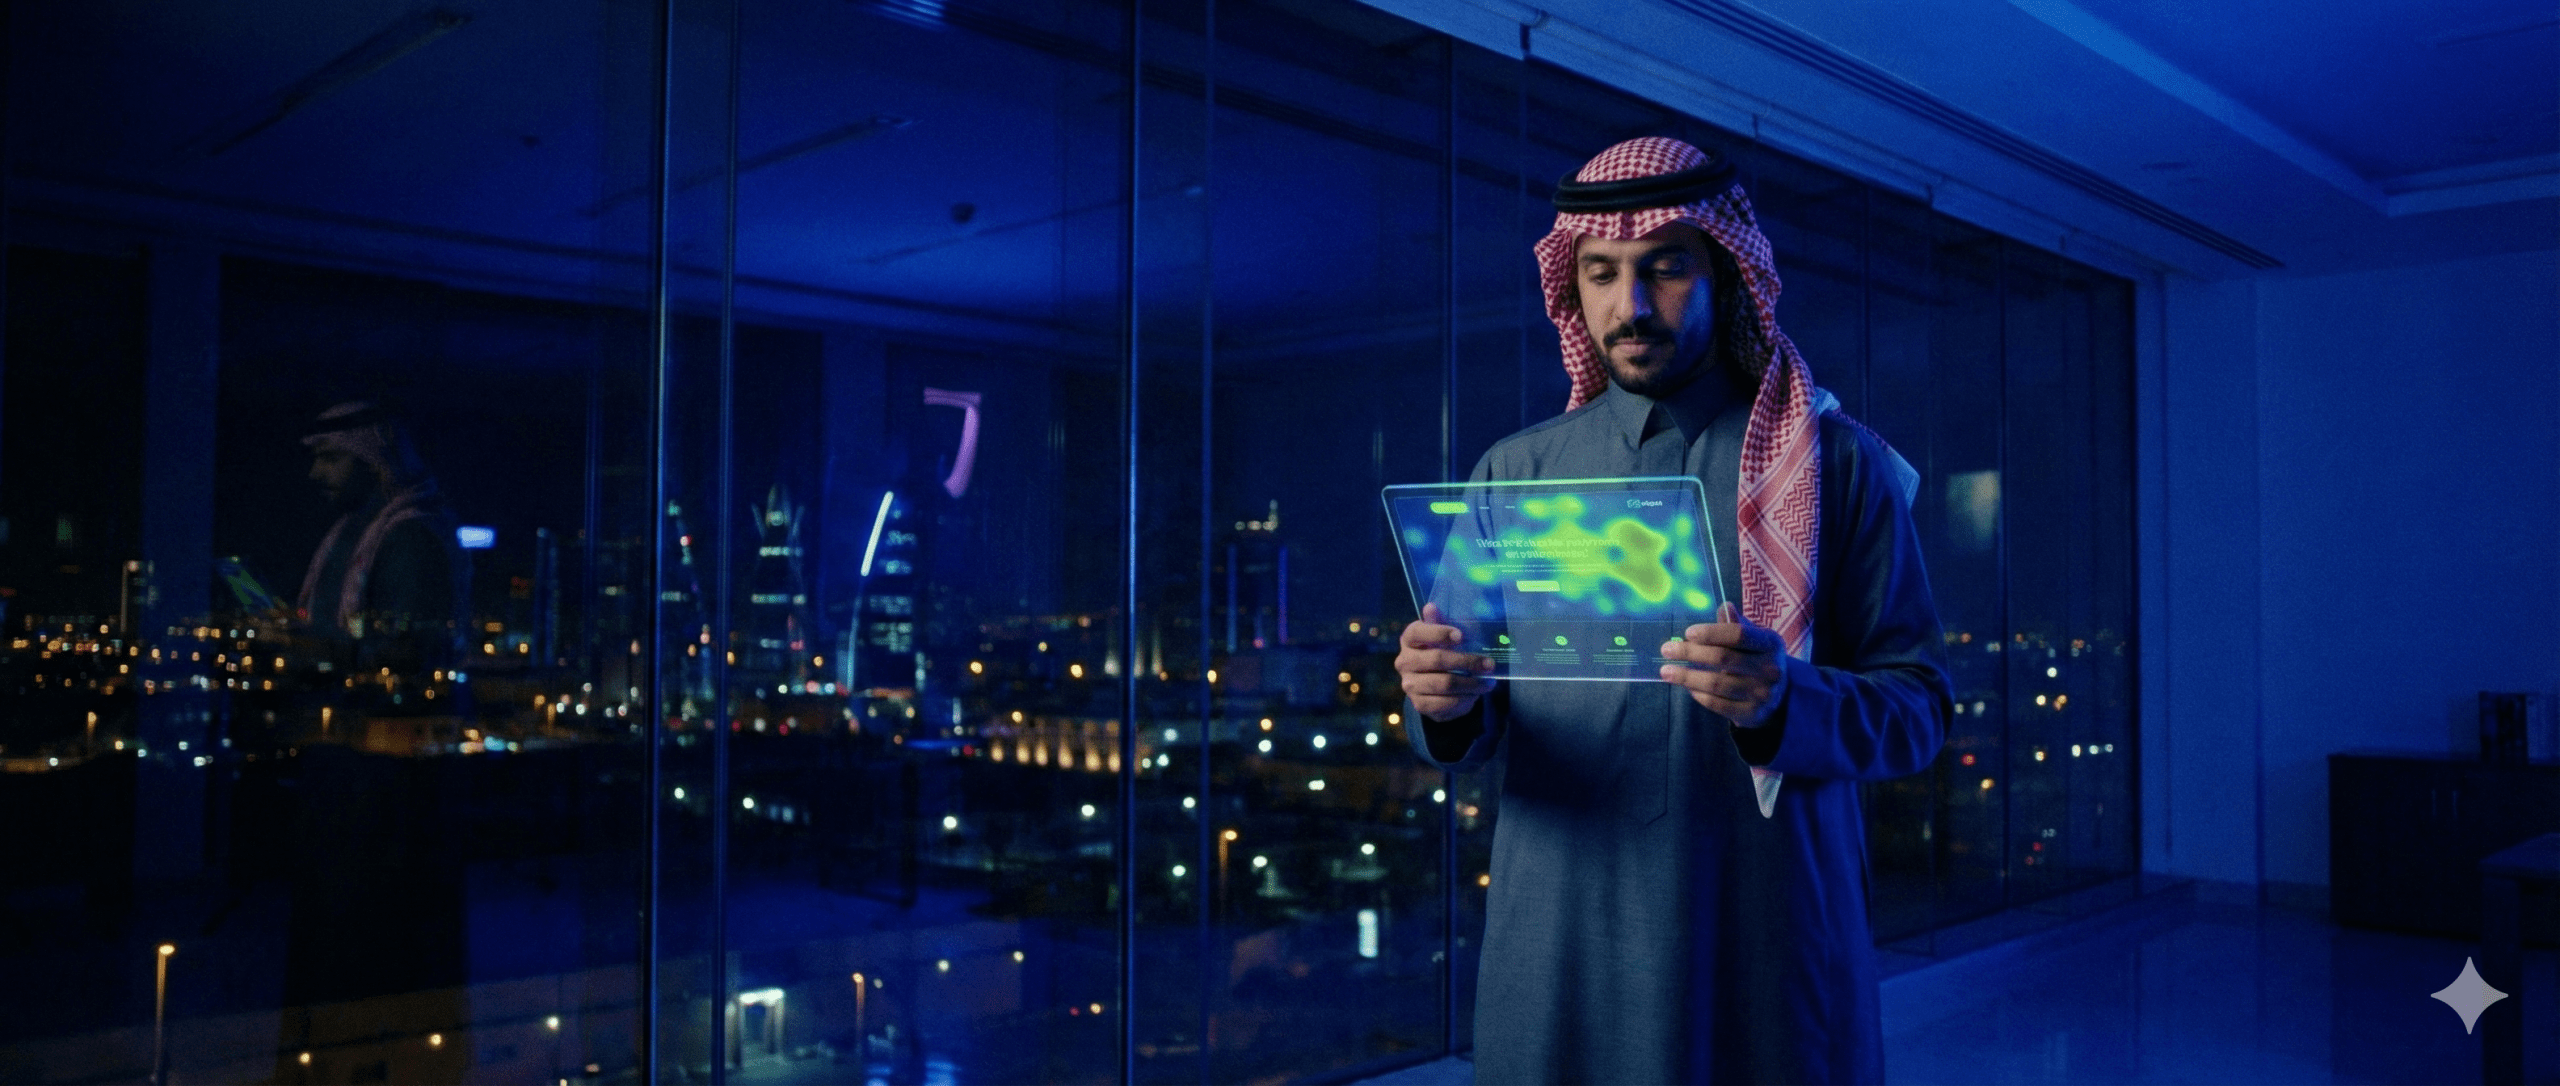
Do you know what your site’s visitors do after they arrive? 👀
Do they read the content? Pause at a button? Leave quickly?
Analytics and heatmaps give you the precise answer.
Performance tracking is the foundation of any improvement in the user experience.
Using tools like Google Analytics andHotjar andMicrosoft Clarity, you can monitor visitor behavior and understand what makes them continue or leave the page.
This data helps you build a smarter site and a stronger customer experience.
In this article, you’ll learn:

Performance tracking means collecting precise data that describes user behavior within your site or app.
This includes clicks, mouse movement, session duration, and the places where visitors exit.
This data isn’t just numbers; it’s the “digital language of customers” that reveals how they actually interact with your pages.
Without tracking, you’re operating on “gut feeling.”
But with analytics tools, you can see the truth:
Where do visitors come from? Which pages do they like? Where do they get stuck or bored?
By analyzing these behaviors, you discover the obstacles preventing them from completing a purchase or registration, and you can fix them with precise steps.
It’s the essential analytics tool for any site.
It shows you:
Use it to learn which content attracts visitors most, and when they leave the site.
Hotjar gives you a visual picture of visitor behavior:
you see where they click, where they pause, and where they ignore elements.
The strongest feature? You can identify the “dead zones” on the page — the spots no one ever clicks — and redesign them based on actual data.
Clarity records sessions live (like a video).
You see how the user moves through the page, where they pause the mouse, and where they leave.
A bonus feature: the tool is completely free and supports an unlimited number of sessions.
A quick comparison between the tools:
| The Tool | Key Advantage | Ideal use |
| Google Analytics | General analytics and traffic | Tracking the site’s overall performance |
| Hotjar | Heatmaps and visual interaction | Understanding visual interaction and improving the design |
| Clarity | Detailed session recording | Analyzing the user’s real behavior |
Monitor the exit rate and conversion rate on each page.
If you notice visitors leaving the product page quickly, the problem is usually in the copy, the CTA, or the page length.
Try simple tweaks and watch the impact in the numbers.
Use heatmaps to find the spots where the user pauses or hesitates.
It could be a vague phrase, an unclear button, or a distracting visual element.
Experimentation is the best proof.
Change the button color, the page title, or the image position, and see which version gives better results.
Performance tracking isn’t a one-time task;
it’s an ongoing process that keeps you always knowing what works and what needs adjusting.
Continuous improvement is the secret of sites that sustain sales growth month after month.
Tracking data without a clear analysis plan can waste your time instead of helping you.
Tracking data without a clear plan may waste your time. So at Bateel Tech we offer a digital marketing strategy service that builds you a precise measurement plan ensuring you achieve your goals.
After understanding how to monitor customer behavior and read their movements,
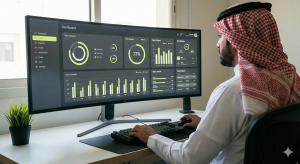
imagine having a complete dashboard that displays all the numbers and interactions on a single screen ✨
in Bateel Tech, we connect Google Analytics, Hotjar, and Clarity for you
and design a smart control panel that instantly shows page performance, conversion rate, and points for improvement.
Try the analytics yourself, or let us set up a professional dashboard for you in one step.
Analysis is the first step toward any real improvement.
Without data, all your decisions remain “guesses.”
Performance tracking = understanding the customer = more conversions.
💡 “Start today by reading your numbers, and let us help you turn them into results.”
Q1: Are tools like Hotjar and Clarity safe to use in Saudi Arabia?
Yes, they can be used while observing local privacy policies and not collecting any sensitive personal data.
Q2: How long does it take to set up analytics for a new site?
Usually one business day is enough to activate Google Analytics and Clarity and connect them to a custom reporting dashboard.
Q3: Can I actually watch user recordings?
Yes, through Clarity you watch sessions as video without knowing the user’s identity, which preserves privacy.
Q4: What’s the difference between the old and new Google Analytics (GA4)?
The new GA4 version relies on events (Events) instead of sessions and provides deeper data for web and mobile apps.
Analysis is just the beginning. To ensure top search rankings, you must organize your content intelligently. Learn about the topic cluster strategy (Topic Cluster) in our upcoming article and how it boosts your site’s ranking
